Monitor Setting
Monitor Setting lets you configure how the Haltdos instance checks its own health and how it alerts when something goes wrong. You can set how many failures count before an instance is considered unhealthy, how quickly it recovers, and define resource usage limits (CPU, RAM, Disk) that trigger alerts when crossed.
How to Use:
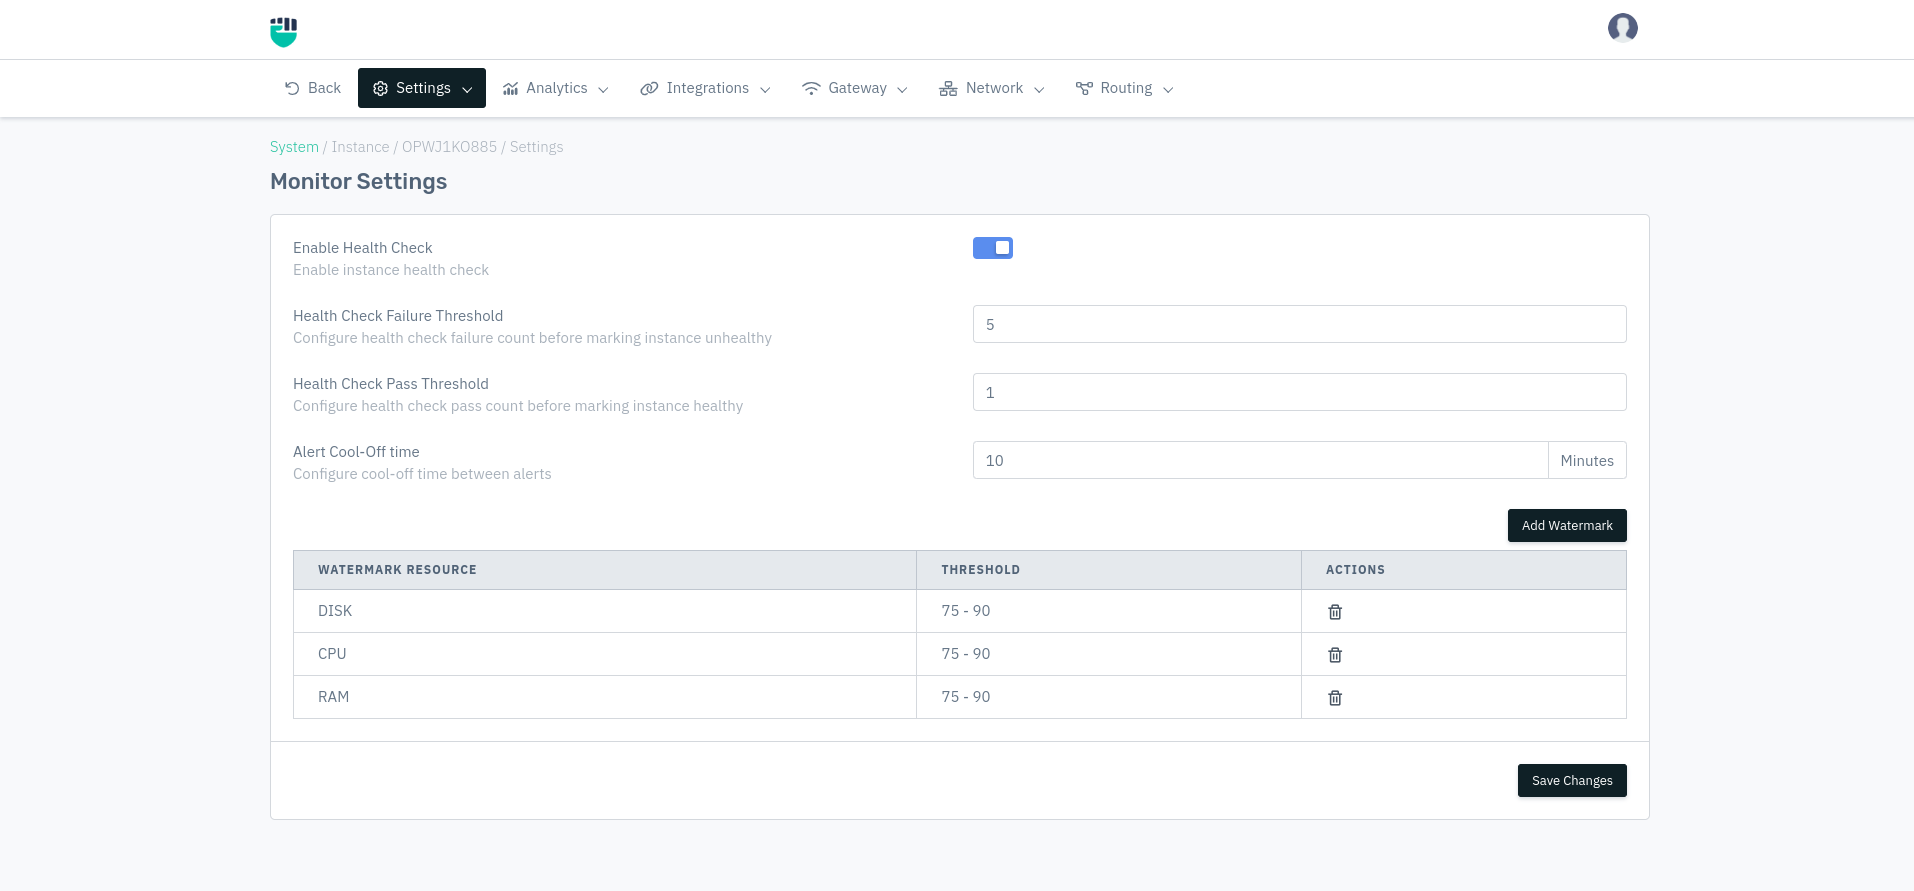
- Go to System > Instance > (Select Instance) > Setting > Monitor Setting
- Configure the health check and alert settings
- To add a resource watermark, click Add Watermark, fill in the resource and threshold.
- Click Save Changes
Description
Enable Health Check
Turns the health check on or off for this instance. When on, the platform periodically checks whether the instance is running fine based on the thresholds below. When off, no health status is reported.
    Accepted values: Enable / Disable

    Default: Enable
Health Check Failure Threshold
How many consecutive health check failures must happen before the instance is marked as unhealthy. Acts as a buffer — a single blip won't immediately mark the instance as down.
    Accepted values: Integer

    Default: 5
Example: With 5, the instance must fail 5 checks in a row before being flagged unhealthy. A single failure followed by a success resets the counter.
Health Check Pass Threshold
How many consecutive successful health checks must happen before a previously unhealthy instance is marked healthy again. This prevents an instance from bouncing back to healthy too quickly after a brief recovery.
    Accepted values: Integer (minimum: 1)

    Default: 1
Example: With 2, the instance needs to pass 2 checks in a row before it's considered back to healthy.
Alert Cool-Off time
The minimum gap in minutes between two consecutive alerts for the same instance. Prevents getting flooded with repeated notifications when an issue persists.
    Accepted values: Integer (in minutes, minimum: 1)

    Default: 10
Example: With 10, if an alert fires at 2:00 PM, the next alert for the same issue won't fire until 2:10 PM even if the instance is still unhealthy.
Watermark Resource
Watermarks let you define resource usage limits for the instance. When CPU, RAM, or Disk usage crosses the defined range, an alert is triggered. This helps catch resource exhaustion before it causes actual downtime.
To add a watermark, click Add Watermark. The table shows all currently configured watermarks.
| Column | Description |
|---|---|
| Watermark Resource | The resource being monitored — DISK, CPU, or RAM |
| Threshold | The usage % range that triggers an alert, e.g. 75 - 90 |
| Actions | Delete this watermark rule |
Watermark Resource
Which system resource to monitor.
Accepted values : DISK / CPU / RAM
Default         : Blank (required)
Threshold
The percentage range at which the alert fires. When resource usage falls within this range, an alert is sent.
Accepted values : Two integers between 0–100 (format: lower - upper)
Default         : 75 - 90
Examples:
75 - 90— alert when usage is between 75% and 90%90 - 100— alert when usage is critically high
You can add separate watermark rules for DISK, CPU, and RAM with different thresholds for each. The default setup pre-configures all three resources at 75 - 90.