Server Groups
User can determine load balancing mechanism and specify Server Groups.
Server Groups helps user to distributes network traffic to load balance across group of servers, for this at first we define a group name. Creating a group name in Servers Group helps to optimize and increase throughput of the solution.
Purpose of Server Groups:
-
Server Groups is specifically designed for high availability solution. In case, if a server is having a problem another server from the group takes over issue. This ensures the high availability of solution.
-
If an active server from the group requires maintenance, it can be stopped while other servers handles its load. Thus, makes the maintenance easier. The Server Groups can be configured and managed easily without any trouble.
-
Set up is easy because of Server Groups. If we want to change or modify at every server, we can do it easily. Solution provides user to edit or modify the Group Name, Monitor, SSL and save the changes.
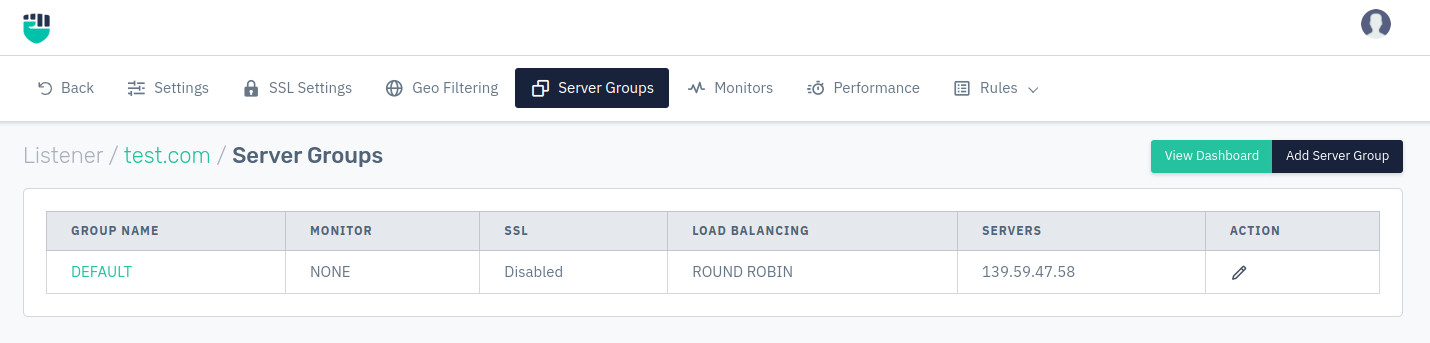
Server Groups provide user two functionality at a page to add Server Group and View Dashboard for optimal solution.
How to Use:
- Go to Stack > SLB > Listeners > Server groups.
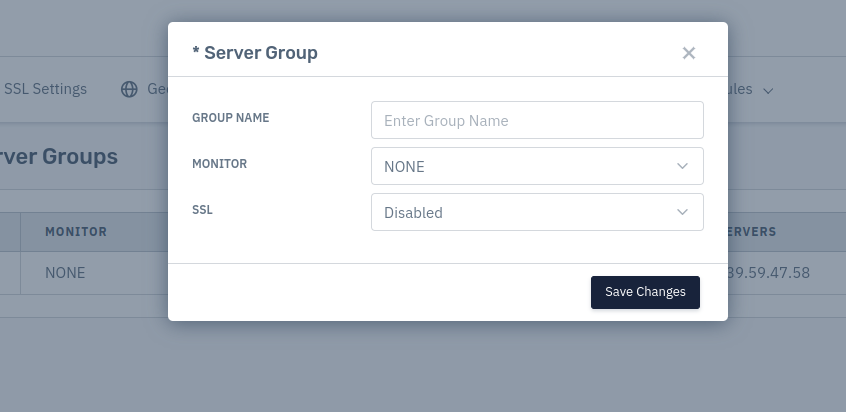
- Click Add Server Group button.
- Configure your settings.
- Click Save Changes.
Description:
Group Name
This option allows users to specify the user-friendly name to identify the Group Name.
    Accepted values: String

    Default: Blank
Monitor
This option allows users to set the monitor type which continuously test upstream server, avoid the failed server and gracefully add recovered servers into the server group.
    Accepted values: Select from existing monitors

    Default: NONE
SSL
This option allows users to enable/disable SSL. It helps to add more operational settings for send information safely and efficiently with the support of SSL Settings.
    Accepted values: Enabled / Disabled

    Default: Disabled
View Dashboard
This option allows user to see the Server Analytics which is a dynamical report of server groups, show the analysis of resources, their upstream summary based on given date range. According to Date Range, dashboard shows report from past 5 Minutes to Custom Range.
This analytics is different from the homepage's analytics because here the dashboard is organized on the basis of server group and the analytics located under the Stack option is organized on the basis of listeners.