Monitors
Overview
Monitoring provides a comprehensive overview of the status and performance of the Server Group and/or individual real servers inside the server group. If a monitor is attached to a server group, then it will get applied to all the servers inside that group automatically. If a monitor is attached to a particular server then it will override the configuration of the server-group monitor. Health Checks computes an overall health state for each upstream server in the listener. Backend(upstream) that responds successfully for the configured number of times is considered healthy. Backend(upstream) that fails to respond successfully for a separate number of times is unhealthy.
How to Use:
- Go to Stack > SLB > Listeners > Monitors.
- Select the Add Monitor.
- Configure your settings.
- Click Save Changes.
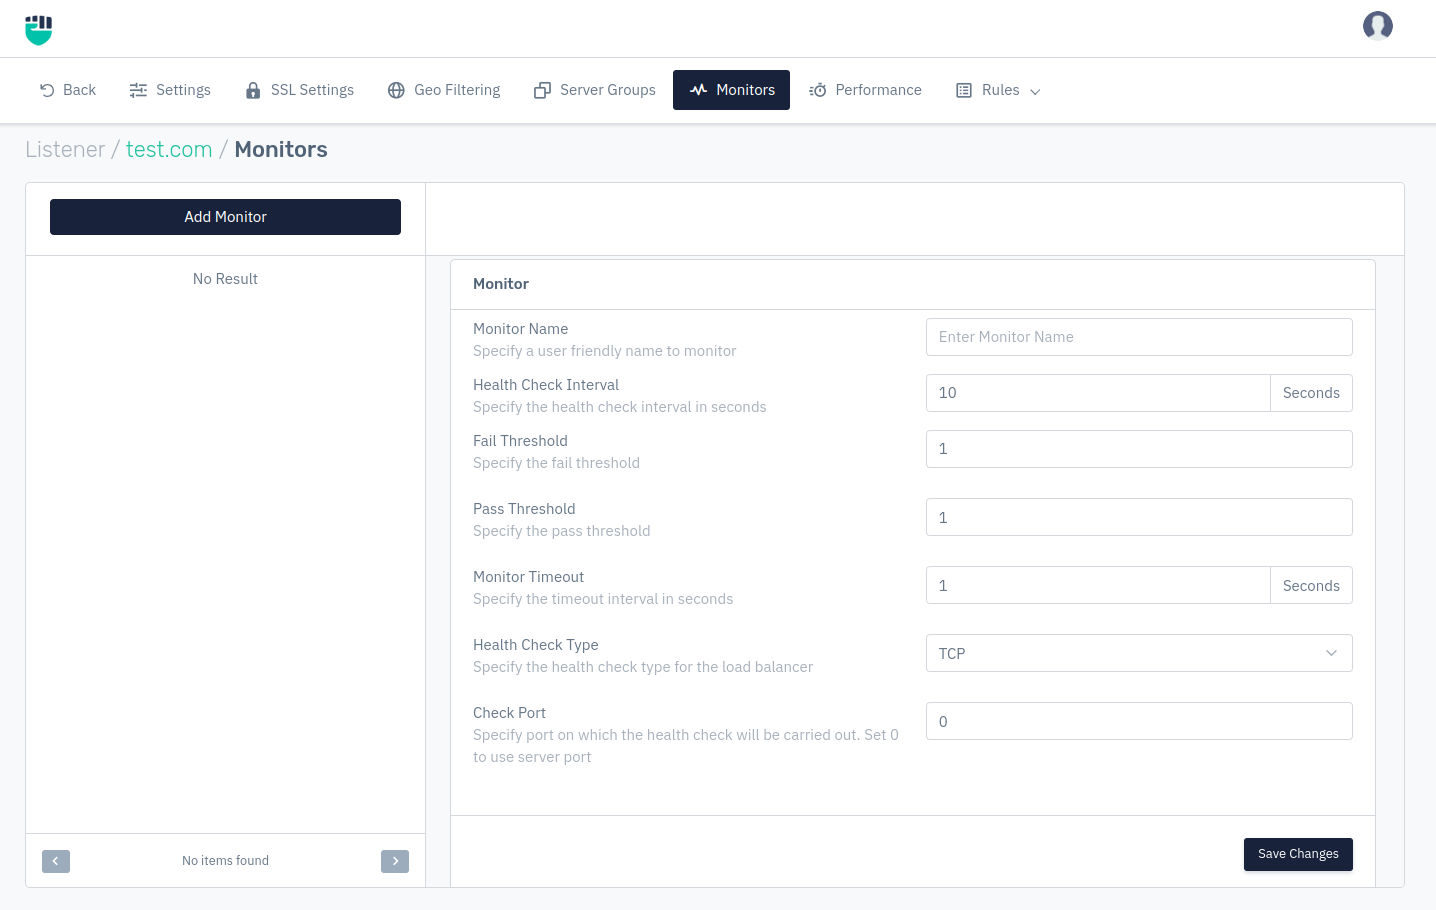
Description
Monitor Name
This option allows users to specify a user-friendly name to monitor.
    Accepted values: String

    Default: Blank
Health Check Interval
This option allows users to specify the health check interval in seconds.
    Accepted values: Integer

    Max: 17280

    Min: 0

    Default: 10

    Metrics: Seconds
Fail Threshold
This option allows users to specify the fail threshold.
    Accepted values: Integer

    Max: 10000

    Min: 0

    Default: 1
Pass Threshold
This option allows users to specify the pass threshold.
    Accepted values: Integer

    Max: 10000

    Min: 0

    Default: 1
Monitor Timeout
This option allows users to specify the timeout interval in seconds.
    Accepted values: Integer

    Default: 1
Metrics: Seconds
Health Check Type
This option allows users to specify the health check type for the load balancer. Under Health Check Type user have various option for different health check type for the load balancer from which user can select, that are as follows :-
    Accepted values: TCP / HTTP / SSL HELLO / HTTPS

    Default: TCP
- TCP - In this, health check will be performed on given port number or server forwarding port.
- HTTP - In this, we can specify HTTP method, URI, match status, check port number & add match content for HTTP protocol.
- HTTPS - In this, we can specify HTTP method, URI, match status, check port number & add match content for HTTPs protocol.
- SCRIPT - This option helps users to use a health check scripts.
- SSL_HELLO - This option allows users to check SSL based handshake on mentioned port number.
- SMTP - This option allows users to check SMTP on mentioned port number.
- POP - This option allows users to check POP connectivity mentioned port number.
- Custom Script - Health check runs custom script (shell script, perl script or Lua script). The script is executed with parameters of server IP and server Port. If the script responds with 1, heath check is passed. If the script responds with 0, we make that server as unhealthy
Check Port
This option allows users to specify port on which the health check will be carried out.
    Accepted values: Integer

    Default: 0
HTTP Method
This option allows users to specify the health check type HTTP monitoring. This option will only be visible when HTTP is selected in Health Check Type.
    Accepted values: Any / Get / Post / Put / Delete / Patch / Head / Options

    Default: Any
Check URI
This option allows users to specify the check URI. This option will only be visible when HTTP OR HTTPS is selected in Health Check Type.
    Accepted values: Regex

    Default: Blank
Match Status
This option allows users to specify the response HTTP status to verify. This option will only be visible when HTTP OR HTTPS is selected in Health Check Type.
    Accepted values: Integer

    Default: 200
Match Content
This option allows users to specify the content to match in the response. This option will only be visible when HTTP, HTTPS, & POP is selected in Health Check Type.
    Accepted values: String

    Default: Blank
Health Script
This option allows users to select your custom health check script. This option will only be visible when HTTP OR HTTPS is selected in Health Check Type.
    Accepted values: String

    Default: Blank