Incidents
The Incidents page provides a centralized view of all events, alerts, and logs generated by the Haltdos ADC platform. It enables administrators to monitor application health, identify security events, troubleshoot traffic issues, and analyze operational logs from a single interface.
Overview
Haltdos continuously monitors the health, availability, and security of your infrastructure. Whenever a significant event occurs, an Incident is generated. These incidents may originate from:
- Haltdos ADC platform services
- Security modules (WAF, Bot Protection, etc.)
- Health monitors
- Load balancer components
- Applications configured in your Stack
- System-generated alerts
The Incidents page allows you to:
- Monitor security events in real time.
- View application and infrastructure alerts.
- Investigate blocked or recorded requests.
- Analyze backend failures.
- Track health monitor status.
- Review access logs.
- Filter incidents based on multiple parameters for faster troubleshooting.
Accessing Incidents
Navigate to:
ADC → Incidents
The Incidents page displays all generated incidents within the selected time range.
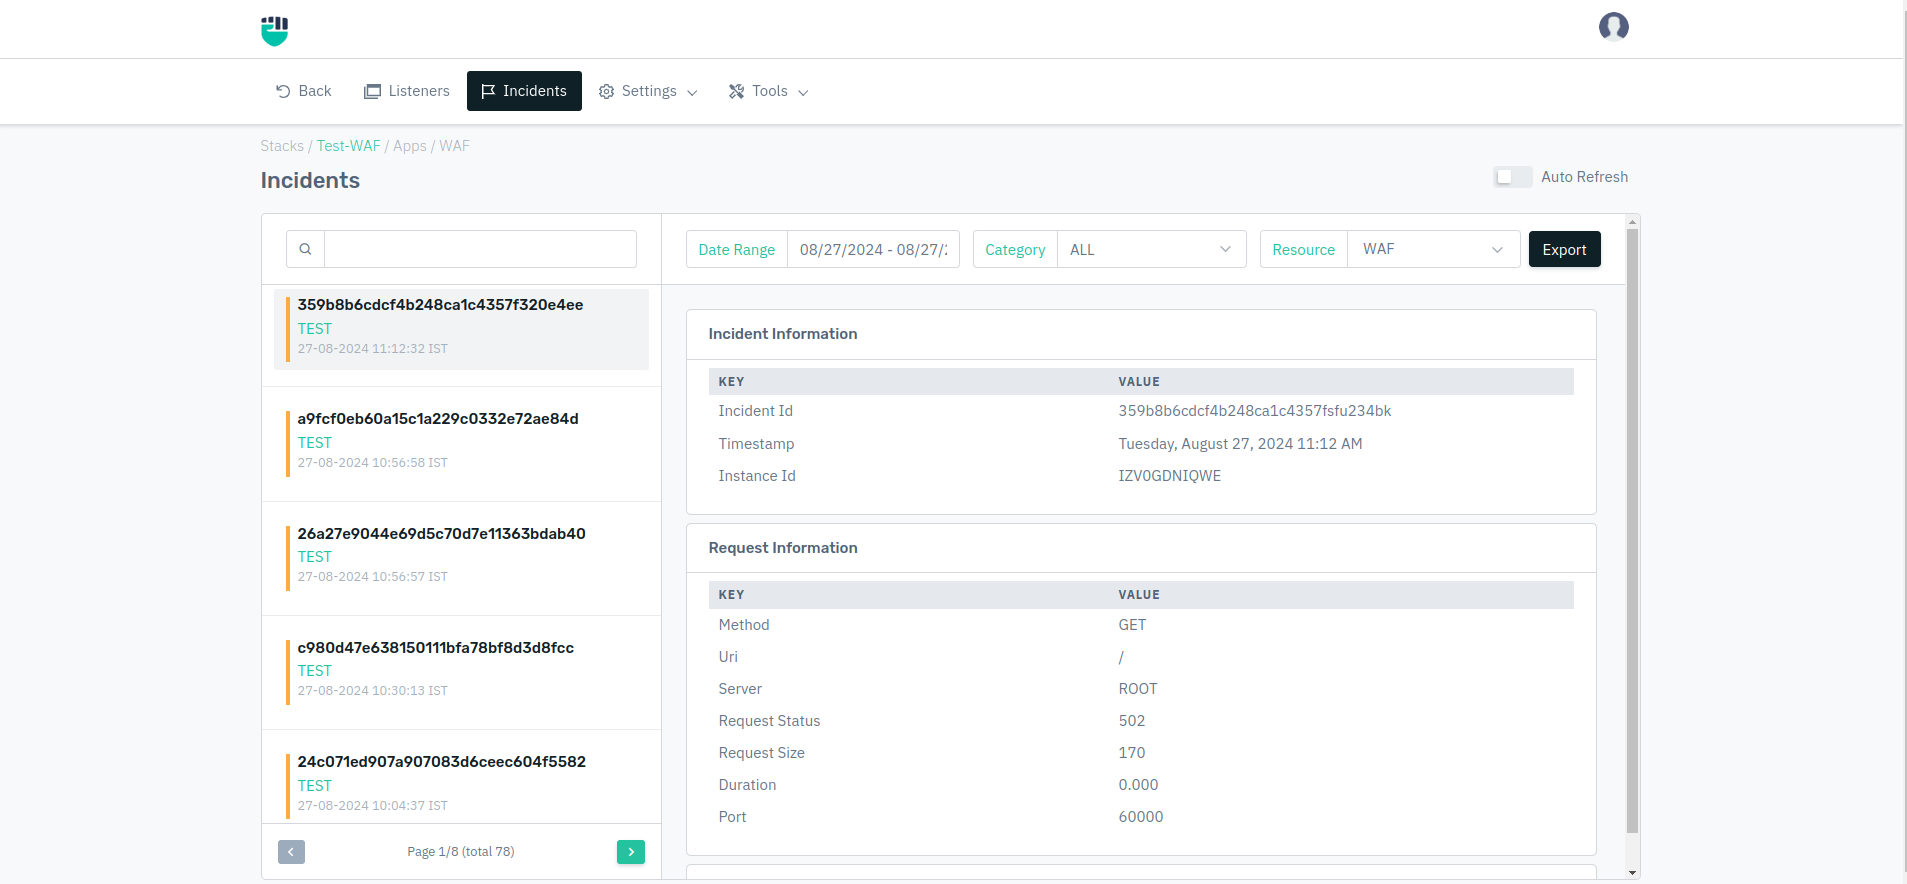
Incidents Page
The page consists of multiple filters and an incident list that helps narrow down events based on specific criteria.
Date Range
The Date Range filter allows you to select the time period for which incidents should be displayed.
Supported options typically include:
- Last 15 Minutes
- Last Hour
- Last 24 Hours
- Last 7 Days
- Last 30 Days
- Custom Date Range
Selecting a shorter time period improves search performance and helps focus on recent events.
Resource
The Resource filter allows you to limit incidents to a specific ADC resource.
Available resources include:
- Entire ADC Stack
- Individual Listeners
For example:
- Selecting ADC displays incidents from every listener within the stack.
- Selecting a specific listener displays incidents generated only for that listener.
This filter is useful when troubleshooting a single application.
Category
Incidents are grouped into categories depending on their source and type.
ALL
Displays every incident regardless of category.
Use this option when performing a complete investigation or reviewing all system activity.
Includes incidents from all available categories, including:
- DROP
- RECORD
- ERROR
- HEALTH
- LOG
Each incident contains:
- Incident Information
- Request Information
- Client Information
- Production Rule Match Information
- Staged Rule Match Information
- Request Headers
- Request Cookies
- Request Params
DROP
Displays requests that were actively blocked by Haltdos.
These incidents are generated when a Security Profile is operating in MITIGATION mode and the request violates one or more configured security policies.
Typical reasons include:
- SQL Injection
- Cross-Site Scripting (XSS)
- Remote Code Execution attempts
- Malicious payloads
- Protocol violations
- IP reputation blocking
- Bot detection
- Rate limiting
Each DROP incident typically contains:
- Source IP
- Destination URL
- HTTP Method
- Request headers
- Request body
- Triggered security rule
- Blocking reason
- Timestamp
These incidents are primarily used for security investigations.
RECORD
Displays requests that would have been blocked if the Security Profile were running in MITIGATION mode.
These incidents are generated when the profile is configured in RECORD mode.
The request is allowed while Haltdos records the event for analysis and rules tuning.
This mode is useful for:
- Testing new security policies
- Monitoring false positives
- Learning application traffic
- Validating WAF configuration before enforcement
Each RECORD incident contains similar information to DROP incidents, including the matched rule and request details.
ERROR
Displays incidents generated due to backend or application failures.
Common examples include:
- HTTP 500 Internal Server Error
- HTTP 502 Bad Gateway
- HTTP 503 Service Unavailable
- HTTP 504 Gateway Timeout
- Backend connection failures
- SSL handshake failures
- Connection reset errors
- Application failures
These incidents help administrators quickly identify service availability issues.
Incident details may include:
- Error code
- Listener
- Backend server
- Response status
- Failure reason
- Timestamp
HEALTH
Displays health monitoring events generated by configured health monitors.
Health incidents indicate changes in the status of backend servers or monitored services.
Examples include:
- Server became Healthy
- Server became Unhealthy
- Health check timeout
- Connection failure
- Backend recovery
- Health monitor disabled
Each event generally includes:
- Monitor name
- Backend server
- Current status
- Previous status
- Health check response
- Failure reason
- Timestamp
These incidents help administrators monitor backend availability and diagnose service outages.
LOG
Displays access logs generated by the ADC.
Unlike security incidents, LOG entries represent normal application traffic.
Typical information includes:
- Client IP Address
- HTTP Method
- Requested URL
- Response Status Code
- Bytes Sent
- Response Time
- Request Method
- Request Path
- Status Code
- Response Time
- User Agent
- Listener
- Timestamp
Access logs are commonly used for:
- Traffic analysis
- User activity tracking
- Performance monitoring
- Request tracing
- Troubleshooting application behavior
Typical Use Cases
The Incidents page can be used for several operational and security tasks.
Security Investigation
Use DROP and RECORD incidents to investigate:
- Attack attempts
- Malicious requests
- WAF rule matches
- False positives
Backend Troubleshooting
Use ERROR and HEALTH incidents to identify:
- Backend outages
- Unhealthy servers
- Failed health checks
- Application errors
Traffic Monitoring
Use LOG incidents to:
- Analyze client traffic
- Verify application access
- Monitor response times
- Review HTTP transactions