Analytics
Overview of Dashboards, Graphs and data analytics
Overview
Haltdos solutions offer a rich set of built-in dashboards that present real-time analytics across different layers of traffic and application activity. These dashboards help users gain visibility into how their web applications are performing, how traffic is flowing, and how security-related events are occurring across the platform.
Analytics information is displayed using interactive charts and tables and is organized per application, allowing users to analyze individual applications (Listener/Zone) or view a consolidated picture across all protected resources.
To view real-time analytics through dashboards.
Auto Refresh
Users can enable auto-refresh to continuously update real-time analytics for incoming requests. Statistics displayed in charts and tables are refreshed automatically every 10 seconds.
Filter
Real-time analytics can be refined using available filter options to focus on specific metrics or resources.
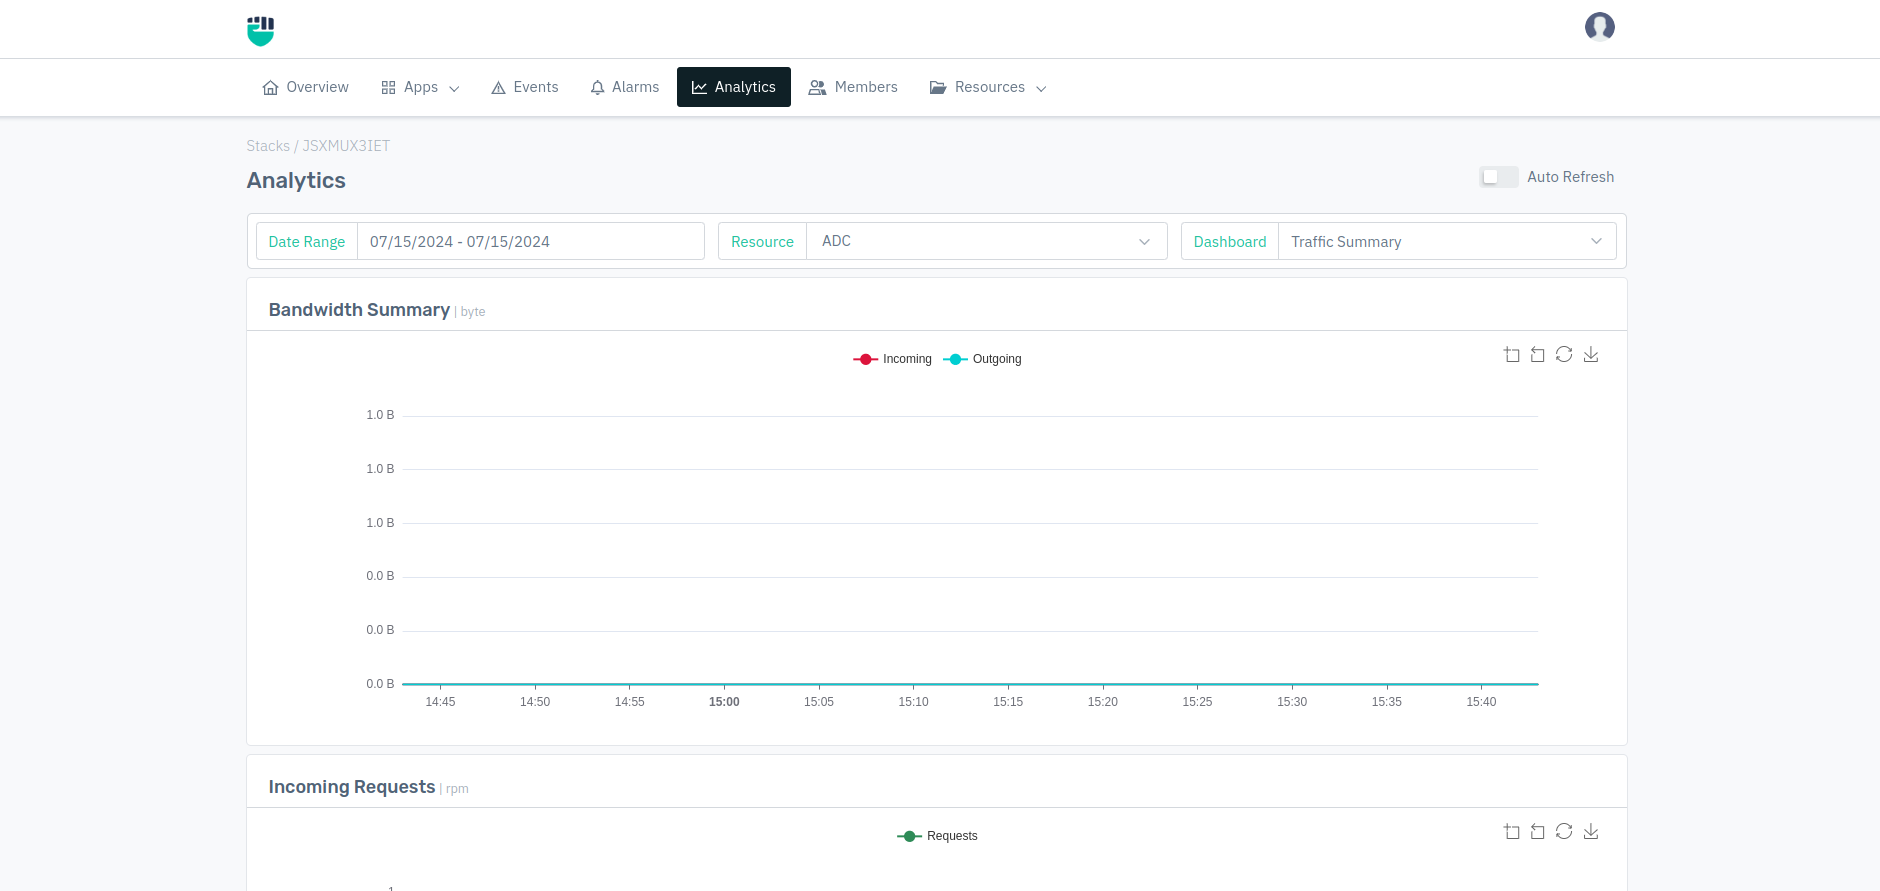
- The diagram below shows histogram data for bandwidth summary.
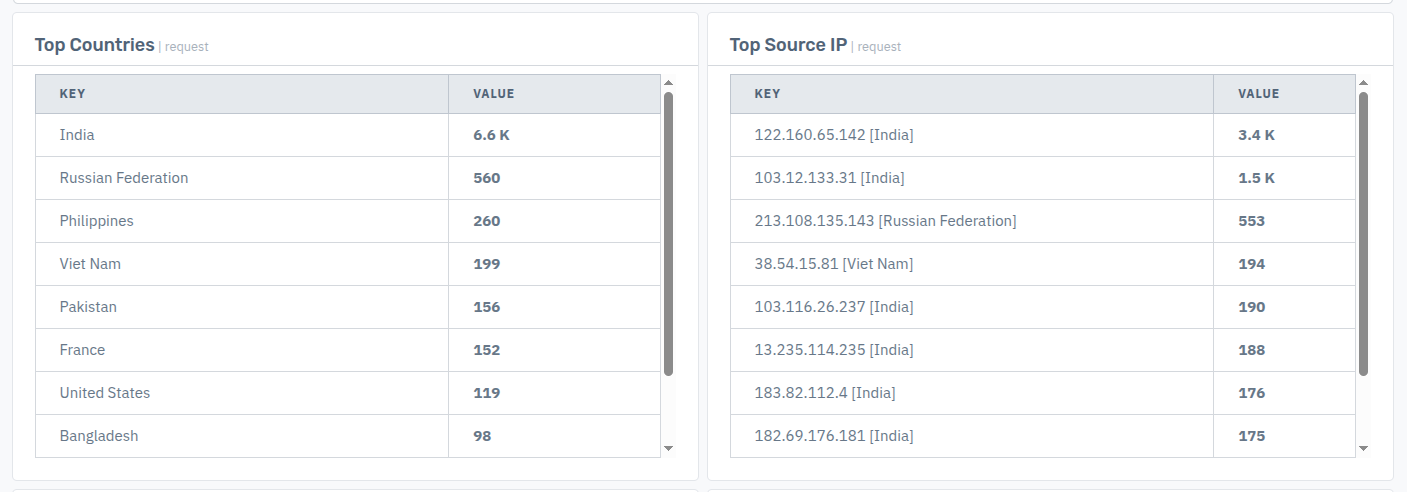
- The screenshot below displays data for Top Source IPs and Top Countries.
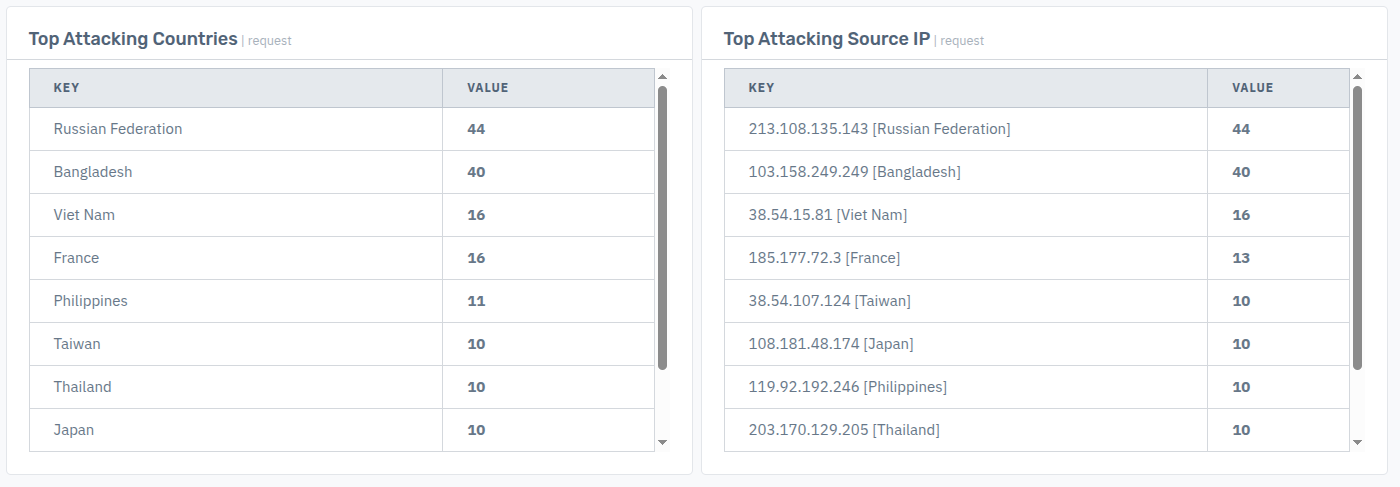
- The screenshot below displays data for Top Attacking Countries and Top Attacking Source IPs.
Users can access multiple default dashboards to monitor overall platform status. Custom analytics dashboards can also be created within the Dashboard section based on specific monitoring requirements.
L4 and L7 Analytics Coverage
The Analytics section includes visibility across both network-level and application-level traffic, enabling users to observe behavior at different layers of the communication stack.
Layer 4 (L4) Analytics
Layer 4 analytics focus on transport and network-level behavior, such as:
- Connection statistics
- Traffic volume and bandwidth usage
- Throughput and latency trends
- Network-level events
Layer 7 (L7) Analytics
Layer 7 analytics provide insight into application-layer behavior, helping users understand how requests are processed and responded to by applications.
This includes visibility into:
- Request and response characteristics
- Application performance patterns
- Transaction-level behavior
Typical transaction-related analytics include:
- Response time and delay
- User-Agent information
- HTTP request and response headers
- Response codes and application behavior
How to Use:
- Go to Stack
- Click Analytics
- Select a Dashboard to view the corresponding analytics.
- From Resources, select the desired Listener, Zone, or Application.
- Use Date Range to view analytics for a specific time period.
| PARAMETERS | DESCRIPTION | ACCEPTED VALUES | DEFAULT |
|---|---|---|---|
| Date Range | Select an appropriate date range no longer than 1 month | Past 5 minutes / Past 1 hour / Today / This week / This Month / Custom | Past 1 Hour |
| Resource / App | Select a specific resource (Listener, Zone, App, or Application) to view per-application analytics, or leave it empty to view analytics across all resources | Select Resource | Empty |
| Dashboard | Select a dashboard consisting of charts and tables for various metrics | Dashboard | Empty |
SSL Analytics and Events
The Analytics section also includes visibility into SSL and TLS-related activity observed during encrypted traffic processing.
Available SSL analytics include:
- SSL handshake statistics
- Handshake type distribution
- Cipher suite usage
- TLS version distribution
- Failed or rejected handshakes
These metrics help users understand encryption usage patterns and identify potential configuration or connectivity issues.
Per Application Analytics and SLA Visibility
Analytics can be viewed on a per-application basis by selecting a specific Listener, Zone, or Application, or as a consolidated view across all resources.
The platform also presents performance-related analytics that help assess service behavior, including:
- Network-level performance indicators
- Per-server response characteristics
- Application response time trends
These insights assist teams in identifying performance bottlenecks and understanding factors that may impact application availability.