Analytics
Overview of Dashboards, Graphs and data analytics
Overview
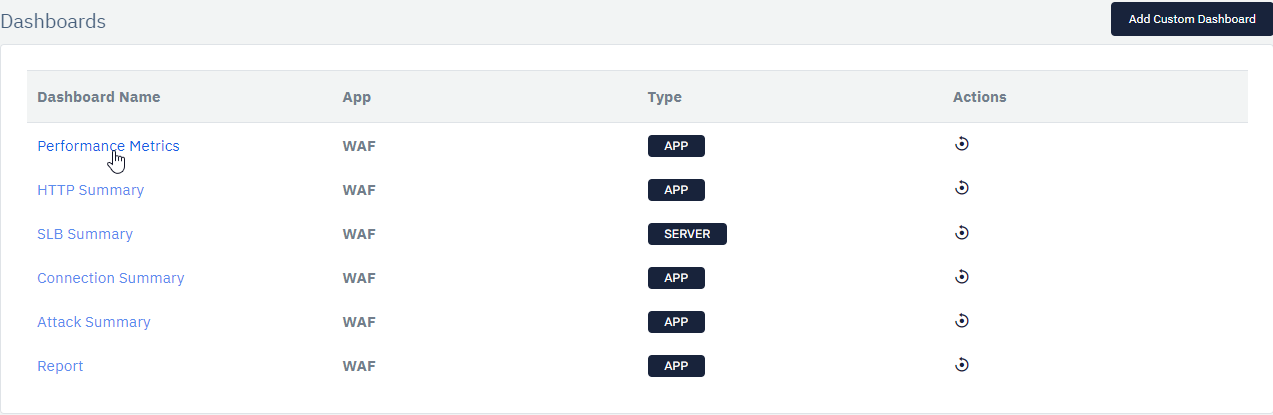
Haltdos solutions provides a rich set of built-in dashboards detailing real-time analytics on every activity on your web application. Dashboards are a means of showing analytical information about your web applications through charts and tables. These dashboards are grouped per App and show details of all the web applications configured under a zone.
To view real-time analytics through dashboards.
Go to Stack -> Analytics.
Auto Refresh
Users can enable auto-refresh in order to refresh the real-time analytics for requests. The statistics will be displayed in graphs and tables in real-time. It auto-refreshes every 10 seconds
Filter
Real-time analytics can be customized using the filter. The following filter options are available:
| PARAMETERS | DESCRIPTION | ACCEPTED VALUES | DEFAULT |
|---|---|---|---|
| Dashboard | Select a dasbhoard consisting of charts and tables on various metrics | Selection | Empty |
| Date Range | Select an appropriate date range no longer than 1 month | Past 5 minutes / Past 1 hour / Today / This week / This Month / Custom | Past 1 Hour |
| Resource / App | Select desired resource (listener, zone, app) or leave it empty for viewing results across all resources | Selection | Empty |