Cluster Deployment
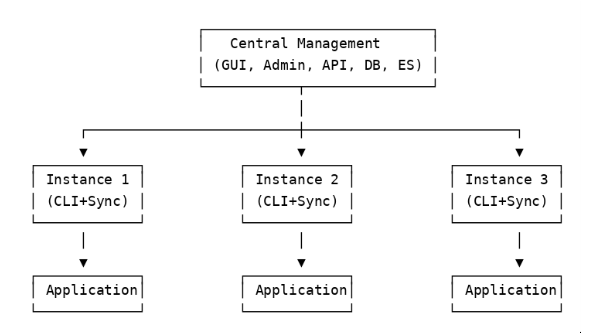
Haltdos Cluster Deployment is one of the deployment models of the Haltdos product. In this model, a central management system controls and manages multiple mitigation instances together. This approach allows centralized policy management, configuration distribution, log collection, and system-wide synchronization from a single point.
1. Introduction
Cluster deployment is used when multiple mitigation instances need to work as a group. All instances are managed centrally to ensure consistent security enforcement and operational efficiency.
2. Deployment Overview
In a cluster setup, a single management system stores configuration, policies, and other required data. It communicates with multiple mitigation instances and ensures they are always updated.
Traffic Handling Modes
- Active-Active Mode: All instances handle traffic simultaneously and share the load.
- Active-Passive Mode: One instance is active while another remains on standby and takes over if the active instance fails.
Overall Cluster Layout:
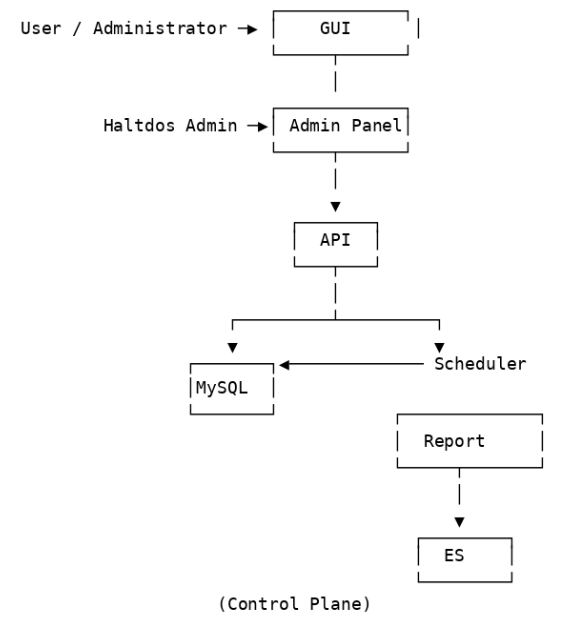
3. Control Plane
The Control Plane is the brain of the cluster setup. It stores configurations, manages policies, and pushes them to all connected mitigation instances to ensure consistency.
Interfaces
- GUI: User-facing interface for administrators to configure policies and manage the system.
- Admin Panel: Internal interface for Haltdos administrators to handle operations, monitoring, scheduling, and orchestration.
Main Components
| Component | Description |
|---|---|
| API | Receives requests from GUI/Admin and communicates with other components. |
| MySQL | Stores all configuration and policy data. |
| Scheduler | Automates periodic tasks and background jobs. |
| Report | Generates system-wide reports. |
| Elasticsearch (ES) | Stores logs and metrics for analysis. |
Control Plane Diagram:
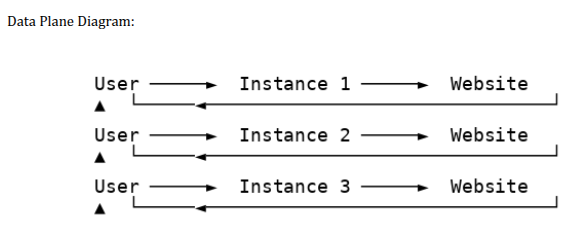
4. Data Plane
The Data Plane handles actual traffic. Mitigation instances receive incoming requests, apply policies (DDoS mitigation, WAF inspection, etc.), and forward only clean traffic to backend servers.
If one instance fails, the others continue processing without interruption.
Data Plane Diagram:
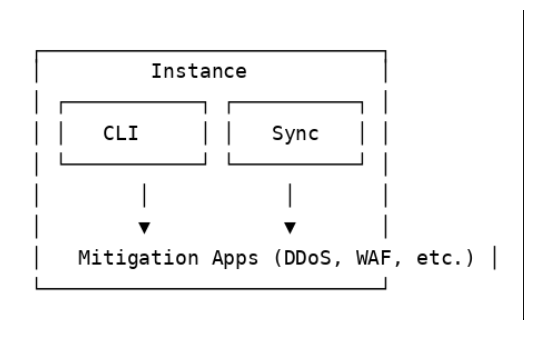
5. Inside an Instance (CLI + Sync)
Each mitigation instance has two essential components that enable synchronization and automation:
- CLI (Command Line Interface): Tools for automation, internal operations, and manual control.
- Sync: Fetches configuration from the management system, writes it to a file, and instructs mitigation applications to update accordingly.
Inside an Instance Diagram:
6. Aux Plane (State Synchronization)
Active instances share state information such as session data, rate limits, and policy updates to ensure consistent enforcement of security rules.
- State Sharing Mechanism: RabbitMQ in a publish-subscribe model
- One instance publishes the state change.;
- All other instances receive and update their state.
Aux Plane Diagram:

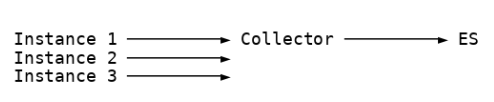
7. Stats Plane (Logs and Metrics)
Mitigation instances generate logs and metrics during traffic processing. These are sent to a Collector, which aggregates them and stores them in Elasticsearch (ES) for dashboards, analytics, and reporting. + Logs and analytics help administrators monitor the system, analyze performance, identify attacks, and troubleshoot issues.
Stats Plane Diagram:
8. Deployment Variations
Cluster deployment can be configured based on operational requirements:
- Active-Active: All instances share and process traffic simultaneously.
- Active-Passive: One instance is active while another remains on standby.
- Mixed Mode: Combination of both modes depending on service or policy type.