Monitor
Link monitoring in Haltdos LLB
Haltdos allows users to configure custom monitoring that can monitor the interface groups. These monitors check the health of the link to assist in efficient load balancing across multiple WAN links.
If any of the links are monitored and marked as down, the traffic will not redirect to the same link unless the link comes up and complete the pass threshold.
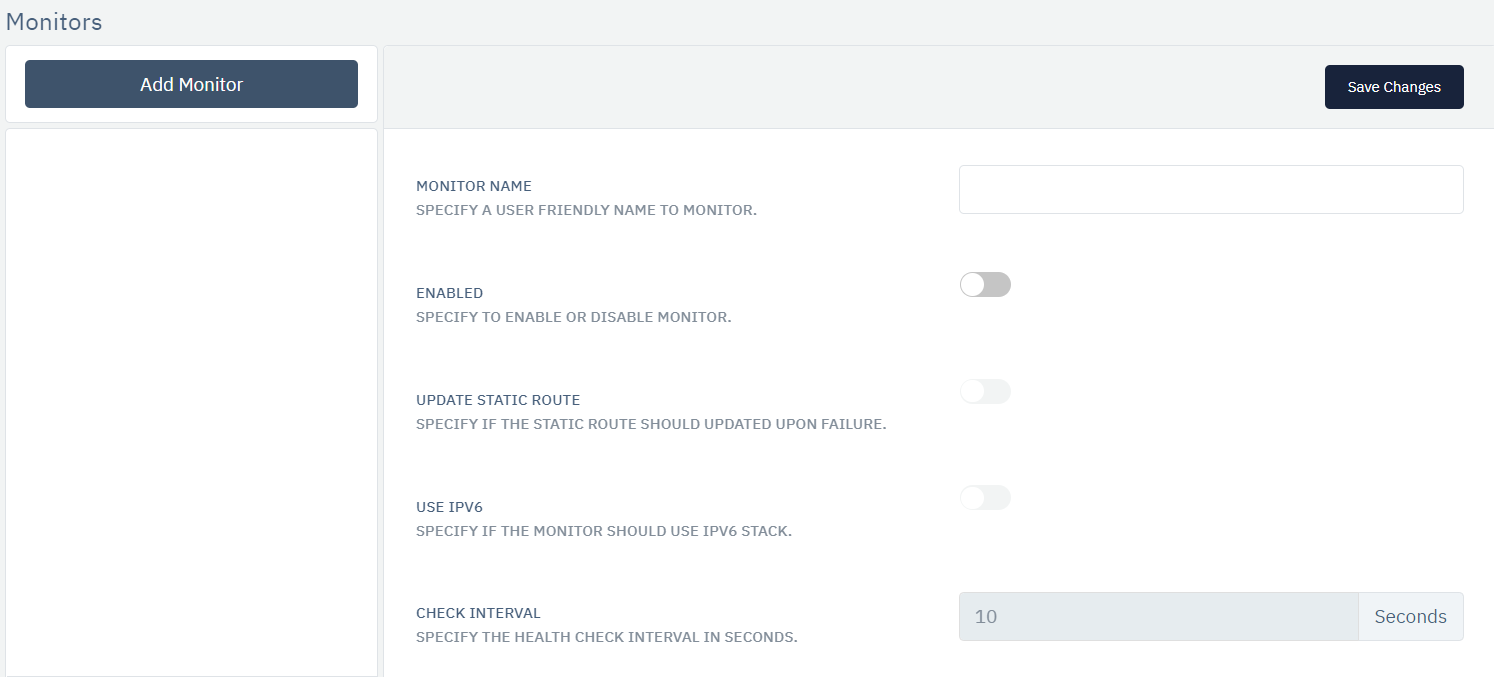
How to Use:
-
Go to Stack >LLB > Monitors.
-
Click Add Monitor button.
-
Configure your settings.
-
Click Save.
| SETTINGS | ACCEPTED VALUES | DEFAULT |
|---|---|---|
| Monitor Name | User friendly monitor name | Blank (Mandatory) |
| Enabled | Boolen | False (Mandatory) |
| Update Static Route | Boolen | False |
| Use IPv6 | Boolen | False |
| Check Interval | Integer | 10 seconds (Mandatory) |
| Monitor type | Drop Down | TCP (Mandatory) |
| Query Server | IP Address of server to send request | None (Mandatory) |
| Port | Port Number to connect the server | 80 (Mandatory) |
| Timeout | Integer | 1 (Mandatory) |
| Fail Threshold | Integer | 1 (Mandatory) |
| Pass Threshold | Integer | 1 (Mandatory) |
| Latency Threshold | Integer | 0 (Mandatory) |
| Jitter Threshold | Integer | 0 (Mandatory) |
| Packet Loss Treshold | Integer | 0 (Mandatory) |
Description:
Monitor Name
This option allows the user to set a name for his monitoring rule.
Enabled
This option allows enable or disable monitor rule. by default, It is set to disable.
Update Static Route
It specifies if the static route should be updated upon failure.
Use IPv6
It specifies if the monitor should use the IPv6 stack.
Check Interval
This option allows the user to set a health check interval for monitoring the services in seconds. After the mentioned time period, defined monitor settings will be checked.
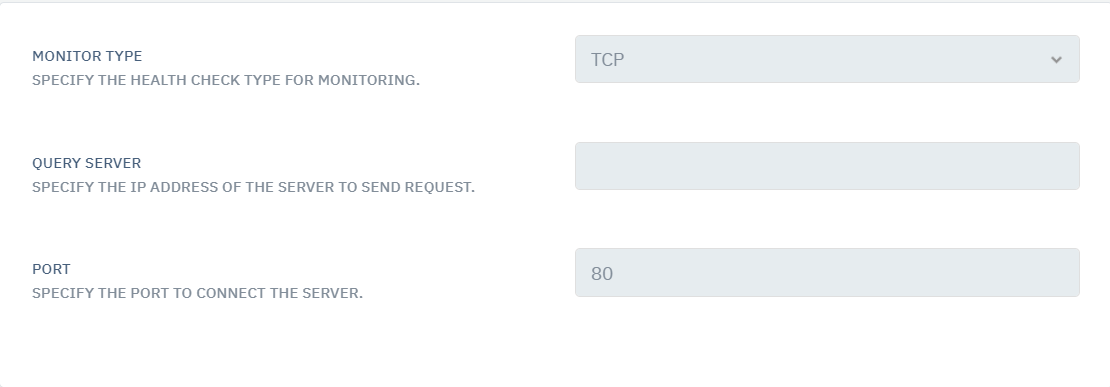
Monitor Type
It specifies the health check type for monitoring. Users need to select the appropriate type of protocol to monitor the interfaces. By default, TCP is selected.
Query Server
This option can only be seen when ICMP/TCP other protocol is selected in the Monitor Type. It allows the user to set the query server IP Address to which the monitor request will send.
Port
It specifies the port number to connect the server when TCP protocol is selected in Monitor Type.
Host Name
This option will only appear when Monitor Type is selected to HTTP/HTTPS. This option allows the user to mention hostname to query.
Expected Response
This option will only appear when Monitor Type is selected to HTTP/HTTPS. HTTP/HTTPS response status codes indicate whether a specific HTTP/HTTPS request has been successfully completed. This option allows users to set the response we get for the HTTP request.
Match Conent
This option will only appear when Monitor Type is selected to HTTP/HTTPS. It will specify the content to match in the response.
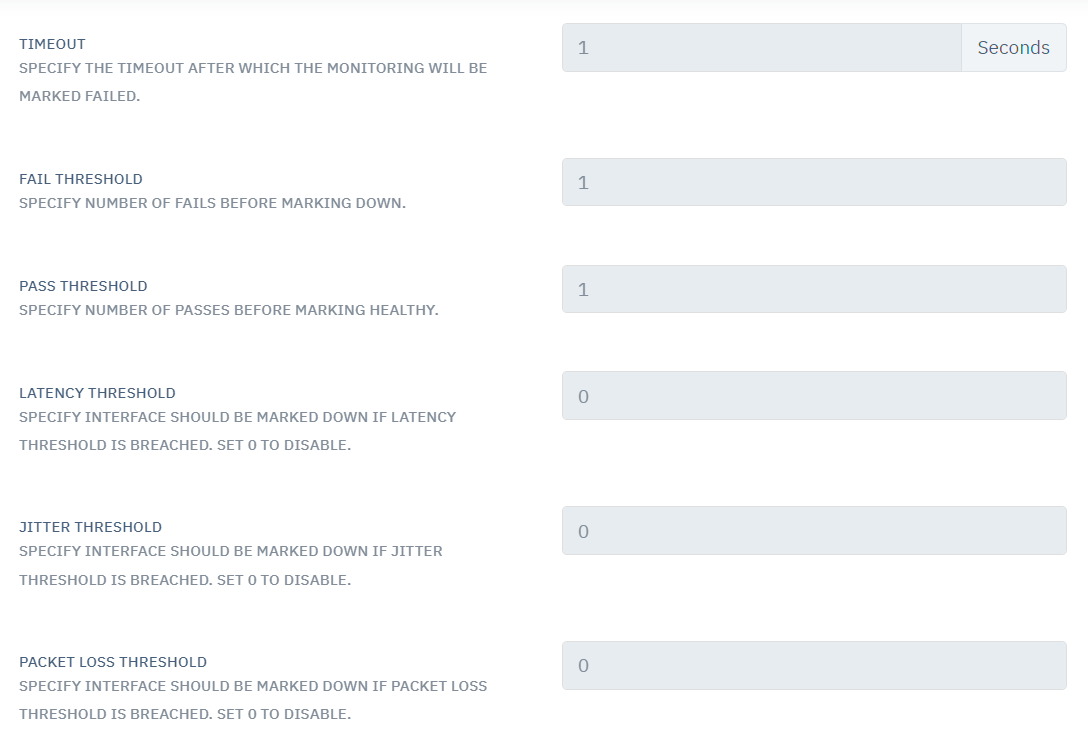
Timeout
It specifies the timeout after which the monitoring will be marked failed. Users can specify the timeout in seconds.
Fail Threshold
This option allows the user to set the integer values for the fail threshold limit. When an already set monitor threshold reaches the specified threshold, it will be marked down. Users can set the threshold on network activities like latency, packet drop, and jitter.
Pass Threshold
This option allows the user to set the integer values for the pass threshold limit. When the set monitor threshold reaches the specified threshold, it will be marked up.
Latency Threshold
Latency is the time it takes for data to pass from one point on a network to another. This option specifies that Interface should be marked down if the latency threshold is breached. By default, the latency threshold is set to 0 which is its disable state.
Jitter Threshold
Jitter is when there is a time delay in sending data packets over your network connection. This option specifies that the interface should be marked down if the jitter threshold is breached. By default, it is set to 0 which is the disabled state.
Packet Loss Theshold
Packet loss occurs when one or more packets of data traveling across a computer network fail to reach their destination. Packet loss is either caused by errors in data transmission, typically across wireless networks, or network congestion. It specifies interface should be marked down if the packet loss threshold is breached. Set 0 to disable.